AS-EEG
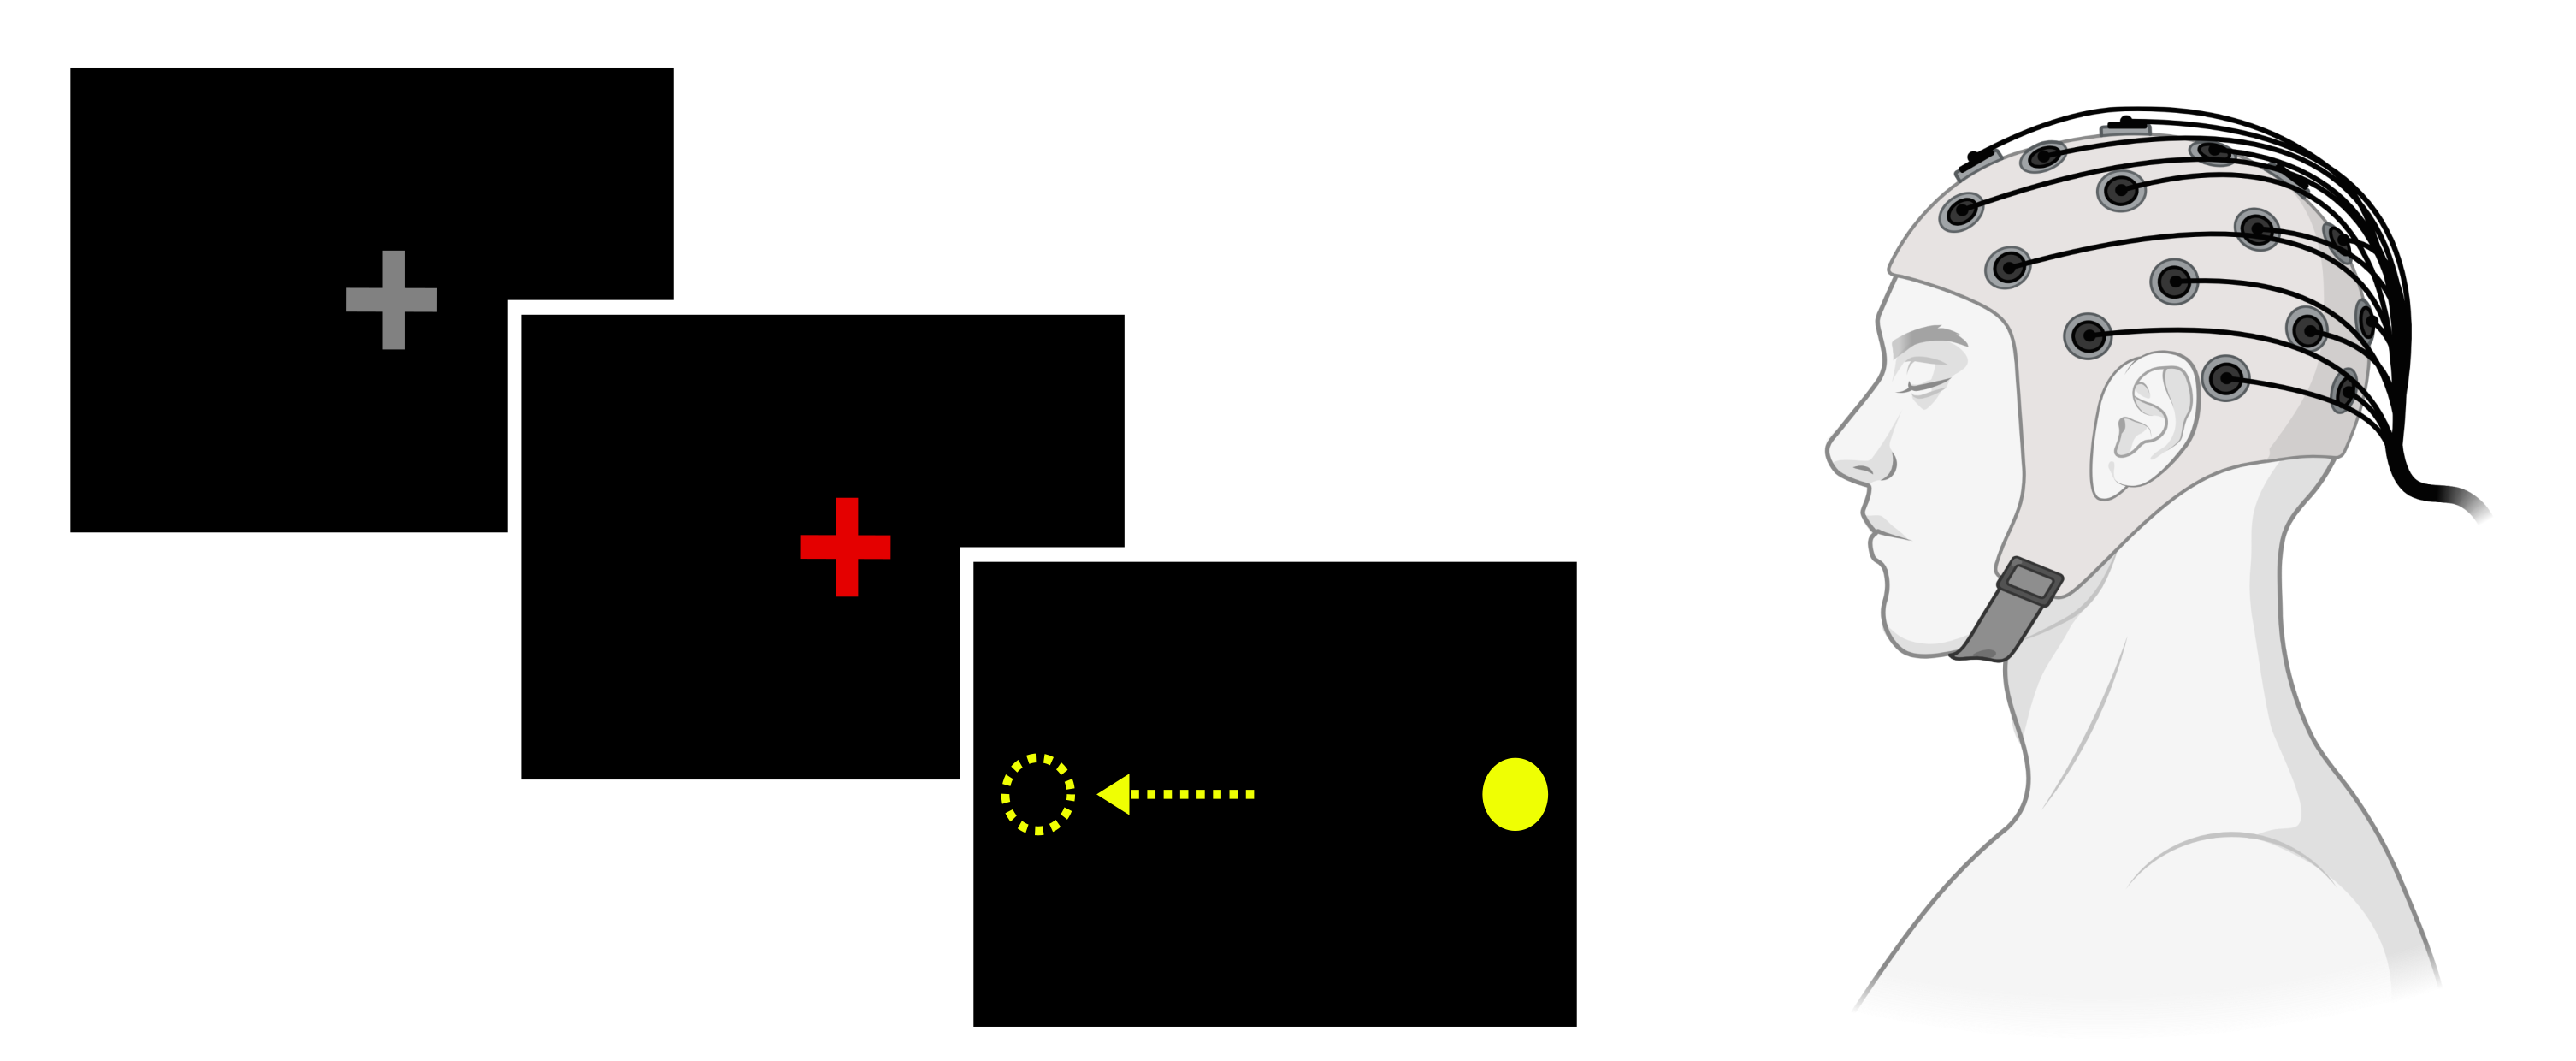
Project Information and Reproducibility Guide
Developmental interactions between oscillatory and spontaneous neural activity support improvements in inhibitory control from adolescence into adulthood
Abstract:
Adolescence is a critical period of development marked by improvements in cognitive control driven by maturation of executive brain systems. Neural mechanisms supporting inhibitory control—the ability to suppress a prepotent response in favor of generating a goal-directed response—mature into adulthood in parallel with refinements in neural frequency-specific neural oscillations and broadband spontaneous activity, supporting more accurate and reliable performance on response inhibition tasks, such as the antisaccade (AS) oculomotor task. Prior work has established that the maturation of neural circuitry (e.g. synaptic pruning and myelination) contributes to age-related decreases in spontaneous activity, supporting higher fidelity transmission of task-relevant activity, such as frequency-specific neural oscillations which are crucial for AS performance. Using longitudinal electroencephalography (EEG) data from 146 participants (72F, 10-34yos, 253 total sessions) during the AS task, we sought to understand the interplay between frontal oscillatory and spontaneous activity during cognitive processing and how it supports developmental improvements in inhibitory control. We found that spontaneous activity developmentally decreased during the preparation of an inhibitory response which was associated with reduced trial-to-trial variability in response latency indicating reductions in spontaneous activity may increase reliability of inhibitory control processing. Furthermore, increased suppression of preparatory high-beta oscillations was associated with decreased latency variability and lower broadband spontaneous activity, with an age interaction indicating this modulation became more pronounced through development. Together, these results illustrate how developmental enhancements in the coordination of frequency-specific oscillations and spontaneous activity during inhibitory response preparation support improvements in inhibitory control, providing a potential mechanism through which inhibitory control becomes more accurate and reliable from adolescence into adulthood.
Project Lead: Abigail M. Beatty
Faculty Lead: Beatriz Luna
Project Start Date: September 2024
Current Project Status: In preparation
Datasets: LNCD 7T
Github Repository: https://github.com/AMB895/AS-EEG
CODE DOCUMENTATION
Outline
| Step | Outputs |
|---|---|
| 1. Pre-processing | Cleaned EEG data ready for analysis |
| 2. Score antisaccade trials | Data table of AS behavioral performance |
| 3. Event-related spectral perturbation | Data table of average ERSP from significant time-frequency clusters |
| 4. Spontaneous/ evoked power | Data table of mean broadband spontaneous/evoked power |
| 5. Statistical analyses | R files with model outputs |
| 6. Paper figures | Generate figures for paper and supplementary material |
Pre-processing
Specific details on pre-preprocessing scripts found in EEG_preprocessing repository from LabNeuroCogDevel. Brief overview of pre-processing pipeline:
- Pre-processing pipeline initiated with run_preprocessing_V2.m
- Inputs are
task(e.g. anti, vgs, rest),maindir(where things are being saved), andrawdir(where raw EEG files are) Within run_preprocessing_V2.m:
- Inputs are
- Raw EEG files were loaded in and trigger values were adjusted to simplier values using remark functions (remark_AS_7t.m for AS trials and remark_vgs.m for VGS trials)
- Pre-processing pipeline was run with preprocessing_pipeline_V2.m which involved the following steps:
- Referenced data to mastoids run_filtering.m
- Bandpass filtered data from 0.5 to 70 Hz run_filtering.m
- Downsampled data to 150 Hz run_filtering.m (for current study downsampled to 150 Hz, preprocessing pipeline has since been updated to downsampling to 512 Hz)
- Rejected noisy channels run_channel_rejection.m
- Interpolated rejected channels run_channel_interpolation.m
- ICA weights generated
- ICA weghts applied to data
- Manual ICA rejection of components corresponding to eye blinks, horizontal/ vertical eye movements, ECG activity, channel noise, or movement artifacts run_manualICArejection.m
- Notch filtered data at 60 Hz run_filtering.m (current study did this at step 9, updated pre-processing pipeline does this during bandpass filtering step)
- Homogenized channel locations, for caps that had 128 channels for comparison to caps with 64 channels
- Data was segmented into epochs, time-locked to the onset of the preparatory period (for AS task only preparatory period of correct AS trials) run_epoching.m
Score antisaccade trials
Electroocculogram (EOG) recorded during the antisaccade task were used to score participants’ behavior. The software used is found in the LabNeuroCogDevel repository, 7TBrainMech_scripts/eeg/eog_cal/
- all_anti.m runs the function score_anti.m for each subject.
- score_anti.m loads antisaccade EEG and the eye calibration EOG data.
- EOG calibration is done using make_cal.m which fits the participant’s eye position to a calibration curve.
- Finds the trial onsets and loops over each trial. Using the triggers from the EEG data and the eye position from the EOG data, each trial is marked as correct, incorrect, or error corrected.
- eog_sacs.m retruns the latency for individual trials. Trials are dropped if response latency is < 100 ms (i.e. anticipatory response) or no eye movement is found.
- Output: table of trial information (trial number, latency, score, drop reason if applicable) is saved for each subject
- all_anti.m compiles each subject’s individual data table. Output: one large trial-level data table with all subjects’ trial-level performance variables.
- anti_eeg_score_analysis.m uses subjects’ trial level data to compute average latency on correct trials, latency variability on correct trials and correct response rate.Output: data table with each subject having their own row of overall AS task performance variables.
MATLAB script naming conventions:
C_: compile data scripts. Use to compile data generated into one matrix/ table across all subjects. (e.g.C_ersp.mcompiles ERSP data into large 4D matrix)G_: generate data scripts. Use to generate data (e.g.G_ersp.mgenerates an ERSP data file for each subject)F_: functions. Functions to run computations (e.g.F_ersp.mis a function that computes ERSP)
Event-related spectral perturbation
- G_ersp.m loads in pre-processed, epoched EEG data (AS and VGS) and loops over each EEG file. Generates ERSP using F_tfpower.m and F_ersp.m at every channel with baseline period defined as 700 to 400 ms prior to the onset of the preparatory period.
- F_tfpower.m uses Morlet wavelets (3 to 35 cycles) to compute the time-resolved power spectrum from 3-70 Hz. Required input is the EEG structure. Optional inputs are
channels(vector of channel numbers to compute power for; default is all channels),evoked(0 = not evoked power, 1 = evoked power; default is not evoked),itc(0 = do not compute ITC, 1 = compute ITC; default is to not compute), andamplitude(0 = do not compute amplitude envelope, 1 = compute amplitude envelope; default is to not compute amplitude envelope). Outputs:power(4D matrix: frequency x time x trial x channel),times(vector of times), andfreqs(vector of frequencies) - F_ersp.m uses the power spectrums generated from F_tfpower.m to compute the ERSP. Required inputs are
power(3D matrix: frequency x time x channel),times(vector of epoch time),baseline_times(vector with when baseline starts and when baseline ends. e.g.: [-700 -400]), andevent_times(vector with when event of interest starts and ends. e.g.: [0 500]). Optional input includesbase_norm(how ERSP is normalized by baseline period. options include: ‘singletrial’,’avgtrial’, or ‘avgtrial_ers’; default is ‘avgtrial_ers’). Outputs: 3D matrix (frequency x time x channel) of ERSP in decibels (dB) and a vector of times which corresponds to the ERSP.
- F_tfpower.m uses Morlet wavelets (3 to 35 cycles) to compute the time-resolved power spectrum from 3-70 Hz. Required input is the EEG structure. Optional inputs are
-
C_ersp.m loads in individual subjects’ 3D ERSP matricies and compiles into one large matrix. Output: 4D ERSP matrix (subject X frequency x time x channel)
- Significant ERSP time-frequency clusters are found using G_erspstats.m and G_tfceersp.m
- G_erspstats.m loads in 4D matrix (subject X frequency x time x channel) and averages across specificed channels for AS and VGS task. At each time-freuquency point the linear mixed effects model
ERSP ~ 1 + Inverse Age * Condition + Sex + (1 | ID)is evaluated and statistical parameters (t-values and beta estimates) are extraced for each model term at every time-frequency point. Outputs: 2D matrix (frequency x time) of t-values and beta estimates were saved for each model term. - G_tfceersp.m loads in the 2D matrix output of t-values from G_erspstats.m as the inputs to the threshold-free cluster enhancement algorithm (Smith & Nichols, 2009). This algorithm outputs a 2D matrix of enhanced t-values. To find significant clusters (p<0.01), the original 2D t-value matrix was permuted 1000 times, inputted into the TFCE algorithm, and the maximum enhanced t-value was extracted for each permutation to build a null distribution. The threshold for a significant cluster was found using the null distribution at p=0.01. Using this threshold, a mask of significant clusters was generated. Outputs: 2D matrix (frequency x time) of enhanced t-values, vector of maximum enhanced t-values form permutations, and a 2D mask of significant ERSP clusters (all for each model term).
- G_erspstats.m loads in 4D matrix (subject X frequency x time x channel) and averages across specificed channels for AS and VGS task. At each time-freuquency point the linear mixed effects model
- C_clusterersp.m loads in the the 4D matrix of ERSP data and averages across specificed electrodes. The significant cluster masks were applied to each subject’s ERSP data and average ERSP from significant clusters were extracted. Outputs: A table of each subject’s average ERSP from signfiicant clusters for AS and VGS tasks.
Spontaneous and evoked power
- GC_sponevopower.m loads in pre-processed and epoched EEG data (AS and VGS) and loops over each subject to compute spontaneous and evoked power, using F_tfpower.m.
- Compute a 4D matrix of total power (frequency x time x trial x channel) and a 3D matrix of evoked power (frequency x time x channel). See Event-related power spectrum section for function inputs and outputs.
- Computes spontaneous power spectrum by subtracting the evoked power spectrum from the total power spectrum.
- Total, evoked, and spontaneous power spectrums are averaged across specified electrodes, time, and trials (for total and spontaneous power). Outputs: data table with average spontaneous, evoked and total power across specified electrodes for AS and VGS tasks.
Statistics
- All main paper statistical analyses are in main_sponevo_ersp_analysis.Rmd. Outputs: rds files with the model, the original data frame, the cleaned data frame, and the model coefficients table.
- R markdown file chunked by different analyses.
- Supplemental statistical analyses are found in supplement_sponevo_ersp_analysis.Rmd. Outputs: rds files with the model, the original data frame, the cleaned data frame, and the model coefficients table.
- R markdown file chunked by different analyses.
Figures
- Main paper figures are generated using Paper_figs.Rmd
- R markdown file chucked by figures. Loads in model outputs from statistical models and plots raw and predicted data for figures. P-value correction using FDR for each group of models.
- Supplemental figures were generated using Supplemental_figs.Rmd.
- R markdown file chucked by figures. Loads in model outputs from statistical models and plots raw and predicted data for figures. P-value correction using FDR for each group of models.
Project Software
- Analyses were done using MATLAB 2021a.
- EEGLAB 2024.2 was used for pre-processing and epoching EEG data.
- LIMO Tools plug-in for EEGLAB was used for the TFCE algorithm.
- Statistical analyses were done using R 4.5.1